AIエージェント開発を加速するコンテキストグラフ作成ツール
 構造化記憶でAI理解度向上
AIエージェント開発におけるコンテキスト層の構築を容易にするCLIツール「Create Context Graph」が登場しました。
Neo4jグラフデータベースを活用し、Agentの意思決定プロセスやデータ関係性を可視化・分析できる構造化記憶を提供します。
これにより、従来のチャットログやベクトル検索では困難だった複雑な質問への回答が可能になり、開発者はより高度なAIエージェントを迅速に構築できます。
AIエージェントの進化が加速する中、単なる「応答」だけでなく「深い理解」を可能にする技術が注目されています。Neo4j Labsが発表した「Create Context Graph」は、AIエージェントの記憶層を従来のベクトルストアから「コンテキストグラフ」へと進化させるためのCLI(コマンドラインインターフェース)ツールです。これにより、複雑な関係性に基づいた高度な推論を可能にするアプリケーションを瞬時に構築できるとのことです。
従来のAIエージェントの課題
近年、AIエージェントの構築自体は容易になりつつあります。様々なフレームワークを使えば、チャットのストリーミングやツールの呼び出しといった基本的な機能は短時間で実現可能です。しかし、従来のシステムでは、「なぜその判断をしたのか」「どの患者に、どのような治療を推奨したのか」といった、複数の情報が絡み合う構造的な質問に答えることが困難でした。
これは、単なる会話履歴や過去のコンテンツを保存するベクトルインデックスでは対応できないからです。真の答えは、情報そのものではなく、それらの要素間の「関係性」に存在していると指摘されています。
コンテキストグラフの仕組みと利点
Create Context Graphは、この「関係性の欠如」というギャップを埋めるために開発されました。これは、AIエージェントの記憶を単なるデータ群ではなく、相互に繋がった「グラフ構造」として保存する手法です。これにより、エージェントは単に情報を思い出す(Recall)だけでなく、世界を理解する(Understanding)ことができるようになります。
具体的には、人(Person)、組織(Organization)、イベント(Event)といったエンティティを定義し、それらの関係性をグラフとして表現します。さらに、エージェントが意思決定を行う際の思考プロセス自体を「DecisionTrace」として記録することで、「何をしたか」だけでなく「なぜそれを選んだのか」という推論の経路を追跡可能にしています。
開発の容易さと実用性
このツールは、`create-next-app`のようなCLIとして機能し、単一のコマンド実行だけで、フルスタックなアプリケーションを生成します。FastAPIバックエンド、Neo4jに接続された知識グラフ、ストリーミングチャットを備えたNext.jsフロントエンド、そしてAIエージェント本体までが揃うとのことです。
さらに、Linearなどの実際の開発ツールと連携するデータコネクタも提供されています。これにより、開発者は自社の既存の業務データや課題管理システムを自動的にグラフ構造にマッピングし、実環境で高度な推論を行うエージェントを構築できると説明されています。
まとめ
Create Context Graphは、AIエージェントを「応答する機械」から「構造を理解し、論理的に推論するシステム」へと進化させる重要な一歩です。複雑な業務課題を解決するための次世代AIシステムの開発を大きく加速させる可能性を秘めていると言えるでしょう。
原文の冒頭を表示(英語・3段落のみ)
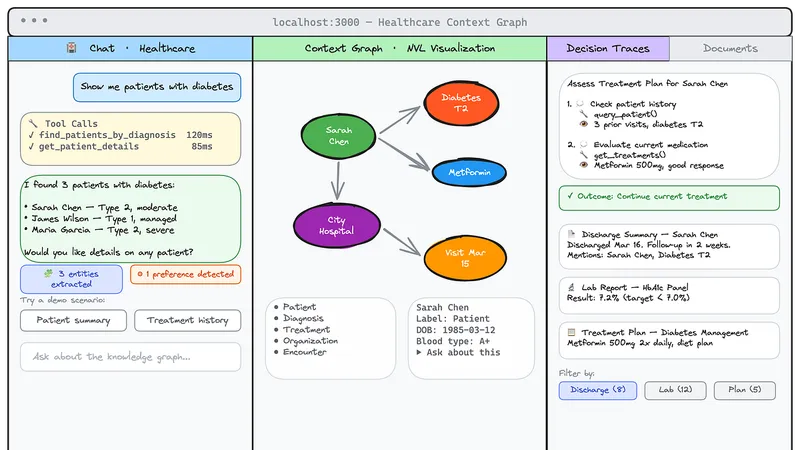
AI Agents With Graph Memory, Scaffolded In Seconds with uvx create-context-graph10 min read1 hour ago--One command to create a a full‑stack context graph agent app — with a knowledge graph, decision traces, streaming chat, and a graph visualization built in.If you’ve built an AI agent in the last year, you’ve probably learned a hard lesson the same way I did: the agent isn’t the hard part anymore. The context layer is.Pick any framework — PydanticAI, LangGraph, Claude Agent SDK, OpenAI Agents, CrewAI, AWS Strands — and you’ll get a streaming chat loop and tool calls running in an afternoon. What you won’t get is an answer to questions like:“Which patient did the agent recommend that treatment for last week, and why?”“What’s blocking the v2 launch, and who has bandwidth in the current sprint?”“Why did we switch from JWT to OAuth2 in the auth service three months ago?”These aren’t similarity questions. They’re structure questions. Connected. Multi-hop. Provenance-aware. The kind of thing a flat chat log or a vector index can’t really answer — because the answer lives in the relationships between things, not in the things themselves.That’s the gap create-context-graph is built to close.create-context-graph is a CLI scaffolding tool - think create-next-app, but for AI agents that need real memory.One command generates a complete, working full-stack application:uvx create-context-graphA FastAPI backend wired to Neo4jA Next.js 15 frontend with streaming chat and an interactive graph visualizationA working AI agent in your framework of choiceA domain ontology schema with entity types, relationships, and Cypher-powered toolsOptional demo data so you can ask real questions on first runPress enter or click to view image in full sizeuvx create-context-graphCreate Context Graph is an open source Neo4j Labs project and is built on top of neo4j-agent-memory - the underlying Python package that gives every generated app three memory types in one connected graph.uvx create-context-graph my-app \ --domain healthcare \ --framework pydanticai \ --demo-dataThat single line gets you a runnable agent app with realistic patient, provider, diagnosis, and treatment data — plus an agent that can actually reason about the relationships between them.Most agent memory implementations stop at the first two layers: a chat history and a vector store of past content. That’s enough to make an agent feel responsive. It’s not enough to make it understand.A context graph is what you get when you store all of an agent’s memory as a connected graph and treat structure as a first-class citizen.This is where the agent’s understanding of the world lives. Entities are categorized using the POLE+O model:Person — patients, players, employees, researchersOrganization — companies, hospitals, teamsLocation — places, facilities, regionsEvent — incidents, encounters, sprints, transactions+Object — everything else (issues, documents, code files, products)Every domain (healthcare, financial services, software engineering, gaming, conservation — there are 22 of them out of the box) layers domain-specific entity types on top of POLE+O. So :Patient is a :Person, :Cycle is an :Event, :Issue is an :Object. That cross-cutting type system is what lets you combine domains and connectors without re-modeling everything from scratch.When the agent makes a decision — recommending a treatment, choosing a tool, picking an approach — the reasoning chain is captured as a :DecisionTrace with linked :TraceStep nodes. Each step records the thought, the action taken, and the observation that came back.You don’t just know what the agent said. You know why.Press enter or click to view image in full sizeA context graph is composed of short-term, long-term, and reasoning memory.Vector stores give you recall. The graph gives you understanding. Similarity search is great for finding things that look alike. It’s not great for “find every sub-issue of ENG-101 that’s blocked by an unstarted issue in the current cycle, assigned to someone other than the original author.” That’s a graph query, and it’s the kind of question agents need to answer in real applications.Press enter or click to view image in full sizeScreenshot of the healthcare context graph app.Every tool call the agent makes lights up the corresponding nodes and edges in the graph view in real time. You don’t just see the answer — you see the path the agent took to get there.Each domain ships with a full ontology, demo data, agent tools, and graph schema. A few of the more popular ones include financial services, healthca, gaming, real estate, manufacturing, conservation, data journalism, GIS, hospitality, and a dozen more. Don’t see yours? The ontology is YAML — add a custom domain in a few minutes.The agent file in the generated project is the only thing that changes between frameworks. Tools, memory, and the frontend stay identical. Switch frameworks with one CLI flag — useful for benchmarking or migration.Create Context Graph Data ConnectorsDemo data is fun. Your own data is even more fun and meaningful.The CLI has a --connector flag that imports from real services and maps them into the POLE+O ontology automatically. Two of the most useful for developers are Linear and Claude Code sessions - and they're worth looking at in detail because they show two very different shapes of context graph.Press enter or click to view image in full sizeLinear Home PageUsing The Linear Create Context Graph Data ConnectorThe issue tracking tool Linear is the kind of tool that has a graph hiding inside it. Issues block other issues. Sub-issues roll up to their parents. Cycles contain issues. Projects roll up to initiatives. Comments thread under issues and resolve into decisions. The Linear UI shows you slices of that graph at a time. The Linear connector structures the complete dataset into a Neo4j graph so you can ask questions across all of it in any way, shape or form.Press enter or click to view image in full sizeThe Linear Create Context Graph data connector flow.Generate a Linear API key at Settings → Security & Access → API, then run:uvx create-context-graph my-linear-app \ --domain software-engineering \ --framework pydanticai \ --connector linear \ --linear-api-key lin_api_xxxxxIf your workspace has multiple teams, scope to one with --linear-team ENG.The connector validates the API key, paginates through teams, users, labels, projects, cycles, issues, comments, milestones, initiatives, and attachments, and writes everything to the graph.Press enter or click to view image in full sizeGraph data model of Linear workspace imported using Create Context Graph.The Linear connector doesn’t just import the current state of your workspace — it walks each issue’s history and synthesizes decision traces from state transitions, assignment changes, and priority bumps.Every issue with two or more history entries becomes a :DecisionTrace, with each transition becoming a :TraceStep (thought / action / observation triple), and the issue's current state becoming the trace outcome.So when you ask the agent “What decisions were made about ENG-101?” it doesn’t need to invent an answer from a chat log. It traverses the trace.Press enter or click to view image in full sizeOnce it’s running, drop these into the chat panel and watch the graph view light up:“What’s blocking ENG-101?” — multi-hop traversal of :BLOCKS / :BLOCKED_BY“Who has the most open issues right now?” — aggregation across :ASSIGNED_TO“Show me all blockers for the v2 Launch project.” — joins issue dependencies with project membership“Are there resolved comment threads on ENG-101?” — finds :Comment nodes with :RESOLVED_BY“How did ENG-101 get to its current state?” — traverses the decision traceThese are queries that would require clicking through three or four different Linear views. In the graph, they’re a single Cypher pattern.Press enter or click to view image in full sizeA Claude Code Session History Context GraphThe Linear connector taps into a remote SaaS API. The Claude Code connector does something more personal: it reads the JSONL session files Claude Code writes to ~/.claude/projects/ every time you use it, and turns your own development history into a queryable graph.No API keys. No external services. All local. And surprisingly revealing.Press enter or click to view image in full sizeThe Claude Code data connector for Create Context Graphuvx create-context-graph my-dev-graph \ --domain software-engineering \ --framework claude-agent-sdk \ --connector claude-codeBy default, this imports sessions for the project matching your current working directory. Want everything across every project you’ve ever used Claude Code on? Use --claude-code-scope allThere are several useful filters: --claude-code-since 2026-03-01 to limit by date, --claude-code-max-sessions 50 for the most recent N, --claude-code-content none to import metadata only without message text. Pick what makes sense for your privacy posture and how big your session history is.Every session JSONL becomes a connected subgraph:Press enter or click to view image in full sizeClaude Code session history modeled as a graph.Plus two synthesized entity types that are the real payoff::Decision nodes are extracted from four signals in your sessions:User corrections — when you redirect the agent (“No, use OAuth2 instead of JWT”), the original approach becomes a :REJECTED :Alternative and your correction becomes the :CHOSE one.Deliberation markers — when the agent discusses trade-offs explicitly, the alternatives and reasoning are captured.Error-resolution cycles — failed tool calls that the agent then fixes get linked as decisions about how to fix the problem.Dependency changes — every pip install, npm install, etc. is captured as a dependency decision.Each decision gets a confidence score from 0.0 to 1.0.:Preference nodes are extracted from explicit statements ("always use single quotes", "prefer FastAPI over Flask") and from behavioral patterns (you keep installing pytest and ruff across projects, so those become inferred tool preferences). Confidence increases the more sessions a preference appears in.Press enter or click to view image in full sizeThe four types of decision extraction (corrections, deliberation, error-resolution, dependency changes) for the Claude Code data connector for Create Context GraphThe generated agent ships with a tailored toolset for this kind of data:“What are my coding preferences?” — surfaces your inferred style with confidence scores“Show me the history of config.py" - every session that touched a file“What errors have I encountered most often?” — a personal pattern map of your debugging life“What decisions have I made about authentication?” — traverses :Decision nodes by topic“Trace the reasoning for yesterday’s session” — replays the tool call chain“What tools do I use most?” — your personal usage analyticsData PrivacyWorth being explicit because the data is sensitive: the connector reads only your local ~/.claude/projects/ directory, never modifies the original files, and automatically redacts secrets (API keys, tokens, passwords, connection strings) before storage. By default, message content is truncated to 2000 characters; --claude-code-content none stores metadata only. For the most sensitive work, point Neo4j at a local instance (e.g. Docker or Neo4j Desktop).Composing Data From Multiple Sources With Create Context Graph Data ConnectorsThe Create Context Graph data connectors are composable. For example, to combine data from Claude Code session history, GitHub, and Linear:uvx create-context-graph my-full-dev-graph \ --domain software-engineering \ --framework pydanticai \ --connector claude-code \ --connector github \ --connector linearNow the same agent can correlate:The why (decisions extracted from your Claude Code sessions)The what (commits and PRs from GitHub)The work (issues, projects, and cycles from Linear)All as a single connected graph. “Which issues did I make architectural decisions about, and which PRs implemented them?” becomes a real question with a real answer.By using the POLE+O data model as a base we can implement a cross-domain type system. Once you’ve imported a :Person from Linear and a :Person from Claude Code's git history with the same email, they're the same node. The graph stitches your tools together at the entity level - without you writing a single line of integration code.For the curious, here’s the stack that gets generated:Backend: FastAPI + Python, agent framework of your choiceFrontend: Next.js 15 (App Router) + Chakra UI v3 + TypeScriptVisualization: NVL (Neo4j Visualization Library) for the live graph viewStreaming: Framer Motion + SSE for token-by-token streaming and tool event animationsStorage: Neo4j (Aura, Docker, or neo4j-local)Memory: neo4j-agent-memory - the underlying graph memory packageThe generated project is a real, idiomatic codebase. Edit the agent file. Add custom Cypher tools. Swap the LLM. Customize data/ontology.yaml to add domain-specific entity types. It's yours.The fastest way to feel the difference between a flat-memory agent and a context-graph agent is to run one. The website has a sandbox tour at the top of the homepage, but the real moment is when you scaffold an app against your own Linear workspace or your own Claude Code history and ask it a question that you couldn’t have answered without the graph.uvx create-context-graph my-app --domain software-engineering \--framework pydanticai --demo-dataA few suggested entry points based on what you’re into:You build agents and want to see what graph memory feels like: scaffold the personal-knowledge or software-engineering domain with --demo-data, then ask the agent multi-hop questions and watch the graph viz.You want to put your own work data into a graph: use --connector linear against your real workspace, or --connector claude-code against your local session history.You’re evaluating frameworks: scaffold the same domain with two different --framework values and compare the agent file. Same tools, different ergonomics.You want to understand decision traces: the Decision Traces from Google Workspace tutorial walks through reasoning memory end to end.Everything is open source on GitHub at neo4j-labs/create-context-graph, Apache 2.0. Issues and PRs welcome — this is a Labs project, which means it’s actively maintained and community-supported, but APIs may evolve as we learn what people are building.If you build something interesting, I want to see it. Find me in the Neo4j Community or open a discussion on the repo.The agent isn’t the hard part anymore. Memory is. Let’s give the agents a graph to think in.📌 About: Create Context Graph is a Neo4j Labs project. Built on top of neo4j-agent-memory. Docs at create-context-graph.dev. If you like it, please 🌟 on GitHub
※ 著作権に配慮し、引用は冒頭3段落までです。続きは元記事をご覧ください。