生産性インフュージョン向けCUDAプロファイラー
 CUDAプロファイルの新しい
本稿では、生産性インフュージョンの難しさと、CUDAプロファイラーがどのように異なるかを説明します。
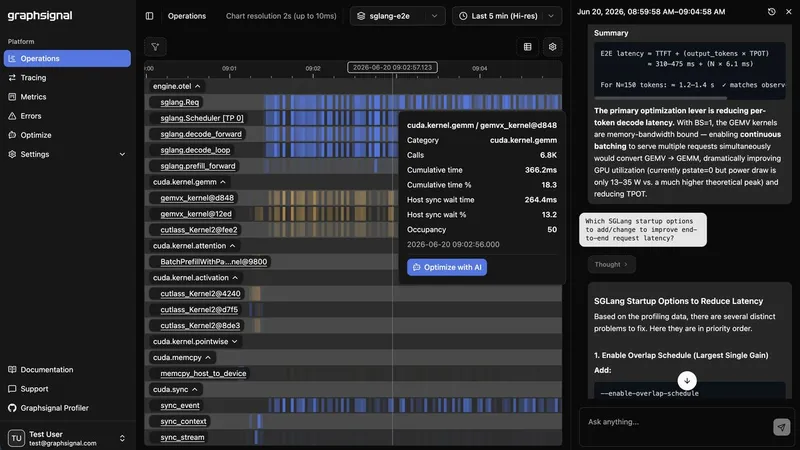
Graphsignalは、低オーバーヘッドで常時稼働するプロファイラーであり、root権限不要で、インフュージョンエンジンレベルの知見を提供します。
原文の冒頭を表示(英語・3段落のみ)
Most CUDA profilers were built for a developer staring at a single run on a workstation. Production inference is a different problem: thousands of requests in flight, GPUs running flat out, and behavior that only shows up under real load. This post looks at what makes profiling production inference hard, and what a profiler designed for it does differently.
What Makes Production Inference Profiling Different
Full kernel traces don’t scale. A serving engine launches kernels at enormous rates. Recording every single kernel call - the default mental model for a dev profiler - produces traces too large to store, move, or reason about, and adds overhead you can’t afford in production. At the same time, second-level metrics hide everything that matters. The useful target is in between: a timeline resolution high enough to expose where GPU activity actually goes, without tracing every call individually.
※ 著作権に配慮し、引用は冒頭3段落までです。続きは元記事をご覧ください。