歴史を視覚化する:ポーランドのシステム
 ポーランドの歴史可視化システ
19世紀にポーランドで生まれた「ポーランド・システム」は、歴史情報をグリッド形式で視覚化する手法です。
世紀ごとに色分けされ、年や出来事を記号で表現することで、世界史を簡潔に把握できます。
フランスやアメリカでも改良され教育ツールとして普及し、記憶術や地理学の要素を組み合わせたユニークなシステムとして注目を集めました。
19世紀、歴史的な情報を記憶するための新しい視覚化手法が世界中で注目されました。それが「ポーランド・システム」です。これは、単なる時系列の羅列ではなく、抽象的なグリッド(格子状の図)を用いて世界史を俯瞰的に把握しようとした試みです。本記事では、この画期的なシステムがどのように考案され、どのように進化していったのかを解説します。
ポーランド・システムの基本構造
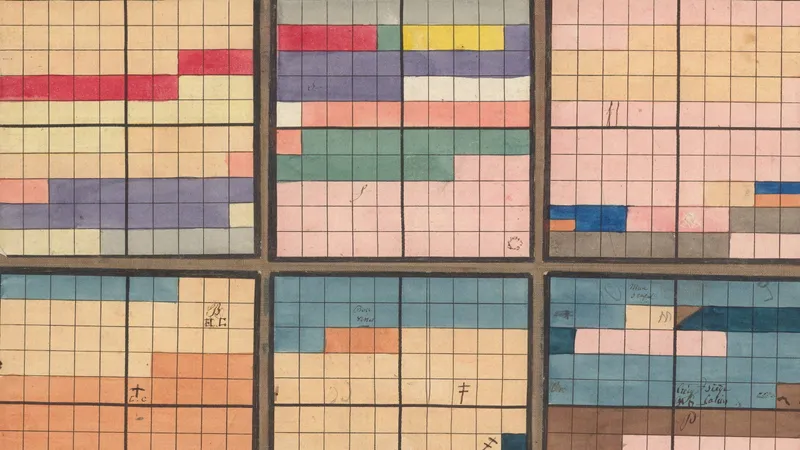
ポーランド・システムは、ポーランドの教育者アントニ・ヤジュヴィンスキによって考案されました。このシステムは、時間と地理情報を結びつける地図作成の伝統を取り入れています。基本のチャートでは、10x10の大きなマス目が「世紀」を表し、その行が「十年」を区切っています。さらに、各マス目(年)には、色や記号を使って国や戦争、条約といった具体的な出来事が記録されました。これにより、チェス盤ほどの大きさの表面上で世界史全体を俯瞰することが可能でした。
記憶補助としての進化と応用
ヤジュヴィンスキは、グリッド形式に加え、「年代の星座」という概念も導入しました。これは、歴史的な出来事を星座の星のように大きな図形の中の「目印」として配置する手法です。このシステムはポーランドから西へ広がり、19世紀のフランスやアメリカで教育ツールとして採用されました。特にアメリカでは、エリザベス・パマー・ピーボディらによって改良が加えられ、さらに細分化された3x3のグリッドが導入されました。
知識の民主化への貢献
アメリカで発展したポーランド・システムは、単なる記憶術以上の意味を持ちました。ピーボディは、この時間軸のグリッドが「歴史的知識の基盤を若者の心に築く」と主張しました。当時、世界情勢の知識は一部の教養ある人々に限定されていましたが、このシステムは、生徒が言葉による説明ではなく、視覚的なグリッドを通して世界史を直接把握することを可能にし、知識の民主化に貢献したと見られています。
まとめ
現代のデジタルデータベースが瞬時に情報を提供する時代において、この19世紀の視覚化システムは、情報をどのように構造化し、記憶に定着させるかという根本的な問いを投げかけています。ポーランド・システムは、歴史学習のあり方そのものを変えた先駆的な試みだったと言えるでしょう。
原文の冒頭を表示(英語・3段落のみ)
Antoni Jażwiński’s Tableau Muet, based on the original “Polish System” for charting historical information, later revised in France and the United States, 1834 — Source.
How does one visualize history and chart time? Is it a line, moving forever outward in one direction? A Grecian temple, as Emma Willard envisioned, with Ionic columns representing centuries, receding from view toward a vanishing point at the world’s origin? Or could it be a corkscrew ascending upward, allowing us to look down from our present position into past events similar to our own? For the Polish educator Antoni Jażwiński, history was best represented by an abstract grid — or at least it was for the purposes of remembering it. The so-called “Polish System” originated in the 1820s and was later brought to public attention in the 1830s and 1840s by General Józef Bem, a military engineer with a penchant for mnemonics. As Anthony Grafton and Daniel Rosenberg catalogue in their Cartographies of Time, the nineteenth century brimmed with new methods and technologies for committing historical information to memory — and Jażwiński’s contribution (and its later adaptations) proved one of the most popular. The Polish System — which almost anticipates Piet Mondrian’s abstract checkerboards and the wider modernist fascination with grid figures — coupled chronology to the map-making traditions of geography. In Jażwiński’s original chart, each main 10x10 box is a century and the rows separate decades. Within a century box, each individual square is a year, each color a nation (with shading for different monarchs or governments), and symbols can stand for marriages, wars, treaties, and other types of events. Should one become proficient with this system, they can peer down on the history of the world, summarized on a surface not much larger than a chessboard. Scroll through the whole page to download all images before printing.In this detail from the above table (showing the years 1751 to 1800), “Corse” appears in the square representing 1769, denoting the French conquest of Corsica; “21 jan” is written over the 1793 square, denoting the execution of Louis XVI (whose reign is shown in the deeper shade of orange) — Source.In addition to the colored grid, Jażwiński also explored other ways of making events easy to remember within the gridded matrix. One of the most striking of these was the idea of “chronological constellations”, laid out in part two of his Méthode polonaise (1835). Here historical events marked in the grid would become guiding points within a larger shape, as stars function in a heavenly constellation — “sometimes it's a chair, a sickle, a boat, a letter of the alphabet, etc.”Scroll through the whole page to download all images before printing.Illustration of a “chronological constellation” from "the century of Constantine the Great", from Antoni Jażwiński's Méthode polonaise (1835) — Source.From Poland, Jażwiński’s system moved westward. In the 1830s, for instance, it became an official pedagogical tool for teaching history across France. By the 1850s, a revised and improved version preoccupied educators in the United States and Canada. Here the chart was imagined to be a technology of almost limitless potential. As Nelson Loverin wrote, in his grandly-titled Loverin’s Chart of Time (1882), the Polish System’s “centograph” allowed the student to “[c]ultivate the memory by using the eyes, and their nerves of induction as feeders of the grand optic centres, the reservoirs of the mind”. The North American variation was popularized due to the efforts of Elizabeth Palmer Peabody, who opened the first English-language kindergarten, and shared a Transcendentalist philosophical outlook with her brothers-in-law Horace Mann and Nathaniel Hawthorne. It seems Peabody revised the original system in 1850 with the publication of her The Polish-American System of Chronology. To increase granularity, her chart further divides up the (previously) smallest unit into a 3x3 grid, which offered the opportunity to indicate the nature of the remembered historical event — spatializing the births and deaths of people, nations, and technologies.Scroll through the whole page to download all images before printing.A detail from The Polish-American System of Chronology (1850), demonstrating how the 3x3 grid can be used to categorise events — Source.Scroll through the whole page to download all images before printing.Nelson Loverin’s version of the “Polish System” or “centograph” in Loverin’s Chart of Time (1882). Here Peabody’s innovation takes the form of more abstracted characteristics — Source.For Peabody, temporal grids were more than geometric memory palaces; they had the potential to “lay the foundations of historical knowledge in the minds of the young”. In the age of digital databases, where historical dates are offered up by search engines with a quick tap of the thumb, this might seem like a quaint and antiquated ambition. But the stakes of forgetting are palpable in Peabody’s text. Chronological knowledge is a gateway to democratic power, she believed, recalling “the time, within the memory of our living parents, when the boundaries of nations, and their relations in space to each other, were known only to the few cultivated persons who had sufficient activity of imagination to picture them out by means of descriptions in words”. The Polish System fixed this: no longer did a student have to create a picture of the world out of words — now global history could unfurl on a grid before their eager eyes.Scroll through the whole page to download all images before printing.A visualization of the 18th century, one of four large-scale fabric floor charts made by Elizabeth Peabody and reproduced in her Chronological History of the United States (1856). “I” in 1776 represents “Independence Declared”. “F U” and “W” represent the establishment of the Federal Union and the beginning of George Washington’s presidency in 1789 — Source. Scroll through the whole page to download all images before printing.A filled in chart from Elizabeth Peabody’s Universal History (1859) — Source.Enjoyed this piece? We need your help to keep publishing.The PDR is a non-profit project kept alive by reader donations – no ads, no paywalls, just the generosity of our community. It’s a really exciting model, but we need your help to keep it thriving. Visit our support page to become a Friend and receive our themed postcard packs. Or give a one-off donation. Already a supporter? A huge thank you for making all this possible.TagsPublishedMay 5, 2021
※ 著作権に配慮し、引用は冒頭3段落までです。続きは元記事をご覧ください。